Map and terrain (Civ5)
This page is a part of the Lua and UI Reference.
Hexagonal layout
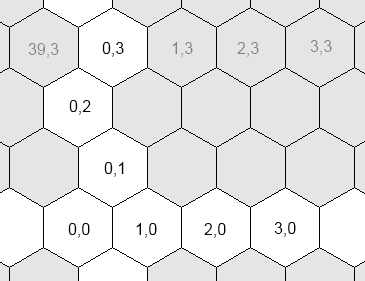
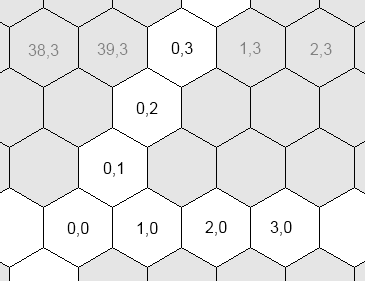
Coordinates systems
Civ5 uses three different coordinates systems for plots:
- The world coordinates. The coordinates of the plot's graphics in the 3D space where the world is rendered. This system is only used when you want to display an icon over the map, through a WorldAnchor.
- The grid coordinates. The logical coordinates of a plot. This is the system returned by Plot:GetX() and Plot:GetY()
- The hex coordinates. The logical coordinates of a plot. Some computations are easier to perform in this system.
The reason behind the coexistence of the grid and hex coordinates is because most computations are easier to perform in the hex system. For example, if you wish to examine the neighbors of a plot...
- In the grid coordinates, you first need to test whether y is odd or even. Depending on the result, the offsets of the top plots will be { (0,1), (1,1) } or { (-1,1), (0,1)}.
- However no such test is required in the hex system: the top offsets are always { (-1,1), (0,1) }.
Usage and conversions in the API
- Most events expect a 2D vector expressed in the hex system. It is often labeled hexPos.
- Whenever you see a gridX, gridY, gridPos, they're expressed in the grid system.
The following global functions will help you:
Vector2
|
Vector2(int x, int y) makes a 2D vector.
| |
int, int
|
ToGridFromHex(int x, int y)
| |
int, int, int
|
GridToWorld(int x, int y)
| |
Vector2
|
ToHexFromGrid(Vector2 hexPos)
| |
Vector3
|
HexToWorld(Vector2 hexPos)
|
Plots indexing
The function Map.GetPlotByIndex(int index) takes an index and returns a plot. This index can be computed as follow:
local w = Map.GetGridSize()
local index = gridX + gridY * w
Enumerating plots
If you need to enumerate plots in specific orders, you should look at Border and plots iterator, a great library from Whoward69 who provides nice iterators for different scan orders.
Otherwise, Map.PlotXYWithRangeCheck offers a simple way to scan neigh or plots given a certain range.
local x, y = ... -- Initialize those
local range = 5
for dx = -range, range do
    for dy = -range, range do
       local plot = Map.PlotXYWithRangeCheck(x, y, dx, dy, range)
       if plot then
            -- Do whatever you want with this plot
       end
    end
end
Rivers
Come back later!

